
Knowledgebase: Visual Expert Features
|
How to activate the diagram generation in VE 2019?
Posted by Carmina Garcia on 05 June 2019 01:28 PM
|
|
How to activate the diagram generation in VE 2019?
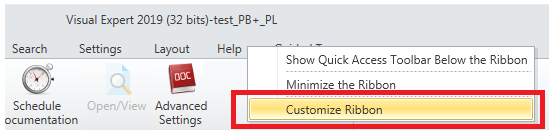
VE 2019 build 19.0519 allows you to activate the diagrams in the impact analysis of your PB and Data Base elements. To activate this beta feature, please go to Beta Features and right click on the menu, you will have a list with 3 options, please select Customize Ribbon.
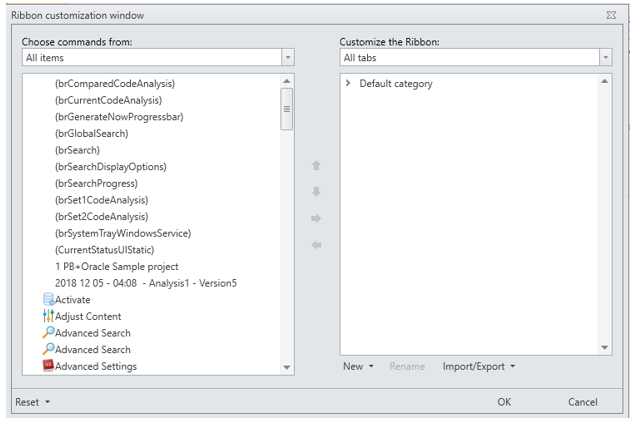
Then click on “Default category”
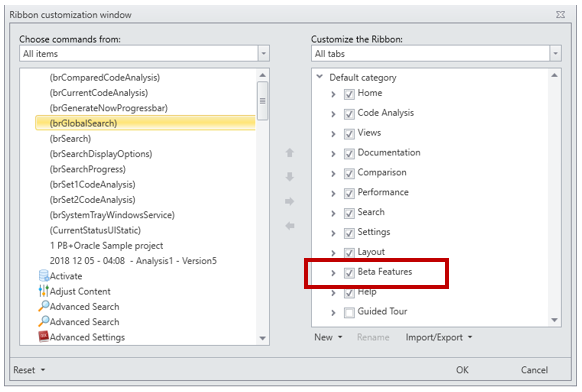
Finally check the box “Beta Features”
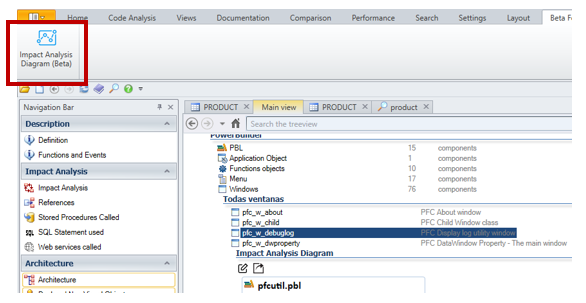
Now you will be able to see the graphs on every impact analysis you do, just choose an object and click on Impact Analyses Diagram (beta)
Please be aware this feature is in beta version, do not hesitate to send us your feedback!
| |
|
|
Comments (0)